Getting Smart on Analytics in the Contact Center

Enterprises are sitting on a treasure trove of data derived from an ever-increasing number of communication channels. 

The promise of Big Data has many forward-thinking contact center leaders dreaming of the insights it can deliver, but getting from raw data to actionable insight is a multi-step journey that begins with deep thinking about the measurements that matter most.

At iQor, we believe that by taking comprehensive measurements, interpreting them in a disciplined and scientific way, and then sharing the resulting analysis with relevant company stakeholders, contact center leaders can put Big Data to work, driving strategic customer initiatives at the highest levels of the organization. 

5 Key Steps to Measurement

Step 1: Decide What You Want to Measure – and at What Level

The first step in the path to Big Data leverage is defining what you need to measure and at what granularity.

  • Do you already have a metric – or even a scorecard – that you use to gauge performance?
  • Do your scorecards address only enterprise-level performance or are you capturing performance metrics at a lower level?

For example, if your goal is to increase overall sales, you need to measure aggregate sales volumes and revenue at the enterprise level. You can often get this data in summary form, directly from your financial systems. But to find specific opportunities for sales improvement, you need to ask questions at progressively lower levels – ideally down to the transaction – where the context of every sale carries a rich set of attributes that you may be overlooking at the enterprise, business unit, salesperson, or even product level.

Defining your enterprise scorecard is important, but when you decide to drill deeper with your measurements – down to every available sale, customer service interaction, or other transaction – you take the first step on the path to Big Data value.

Step 2: Cast a Wide Net

Once you’ve decided upon what you want to measure – from top to bottom – it’s time to take stock of all available data sources. Look across all the information silos in your enterprise. Consider leveraging information from dialers, IVRs, ACDs, workforce management systems, CRM systems, quality audits, CSAT surveys, sales, and HR systems and tap data at the most granular transactional level. For example, don’t settle for summary-level agent call data – get the call detail records (one record per call).

Although some sources may involve millions of data records every day, the keys to unlocking emergent value may be in the small silos, such as spreadsheets where specialists or departmental contributors enter data because no formal application is in place. Big Data computing allows you to process the million-record data volumes alongside the tiny ones – so cast a wide net when you’re thinking about the data that describes your operations. At iQor, we believe that the whole of all the transactional data across these systems is far greater than its parts.

Step 3: Find the Right Measurement Platform

Finding a measurement and reporting system that easily integrates data across your enterprise, converts that data into business metrics, and, most importantly, delivers dynamic views to the business on a timely basis can be a challenge. To truly help change the way you do business, this system must be quick to implement and modify, be intuitive and user-friendly, have scalability, and not be overly dependent upon IT for maintenance. Whether you build it or buy it, your system should be capable of delivering business measurements beyond the contact center so that it eventually incorporates all lines of business.

Step 4: Correlate, Analyze, and Interpret Your Measurements

Once you have data combined from different sources, you’ll begin to paint a new picture of your contact centers’ performance. Like any great painter who experiments with color combinations, you should combine data sets in new ways. The results will correlate performance at multiple levels and likely highlight how one key metric influences another. Expect to discover that real performance improvements are not governed by a single variable, but through a complex, interdependent set of variables.

Step 5: Leverage Results to Educate and Drive Specific Action

Now that you’ve transformed your data to generate reliable metrics, it’s time to switch mindsets from reporting to ROI. Package information in a simple, timely, and credible format. Then, make it accessible to those in your organization – be they contact center agents or C-suite executives – who can create new initiatives and set policies. For example, you can use performance metrics to generate agent ratings in real-time, motivating managers to address issues quickly. Then move beyond the agent level and score the performance of campaigns or programs across different segments, like day of the week or location.

By moving up the measurement and analysis hierarchy, your organization can react quickly to improve performance and evolve methodically toward more sophisticated models that predict future performance. Many contact center leaders already know the value of measuring performance within their organizations. Indeed, many businesses today do it to some extent. However, the tools and the processes many use to do the job are becoming archaic. A group of specialists with access to a data source and an Excel spreadsheet can gather information and crunch the numbers for one-time views of performance, but that is not an efficient, comprehensive, or scalable way to measure performance.

Decide to evolve from distributed, localized measurements that focus solely on collecting single-source data to platforms that generate systematized measurement across all available data sources. This measurement approach scales and expedites the path from raw data to measurement – and eventually Big Data analytics. Learn how performance management and business intelligence solutions can help your organization measure smarter.

Real-Time Performance Dashboards for Agents

Show Me (All) the Money: Why Agents Need Real-Time Access to Pay and Performance

To become faster, runners use fitness watches to track their cadence, mileage, heart rate, and other metrics to evaluate their progress. With a quick glance at the wrist, runners know how they performed and are inspired to do better, be it by adjusting stride length or upping the pace.

Now, think. What if you could create a similar experience for your teams of agents? No running shoes required.

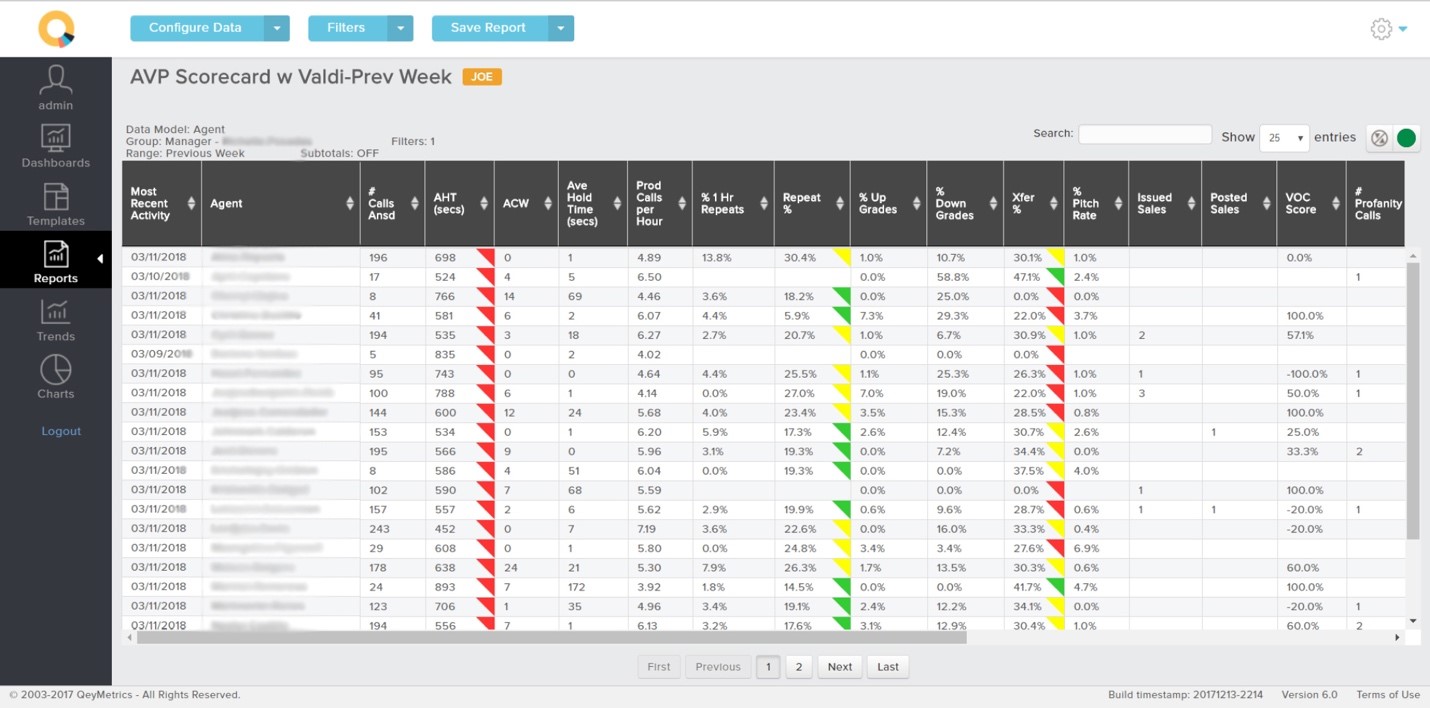
To keep your agents on track, motivated and self-assured, they need the opportunity to review and understand their pay and performance in real-time. A performance dashboard provides your agents with current and past interaction data, including rankings, feedback, and compliance scoring. With this knowledge, agents are better equipped to go the extra mile for your customers and are more motivated to improve their performance and payouts.

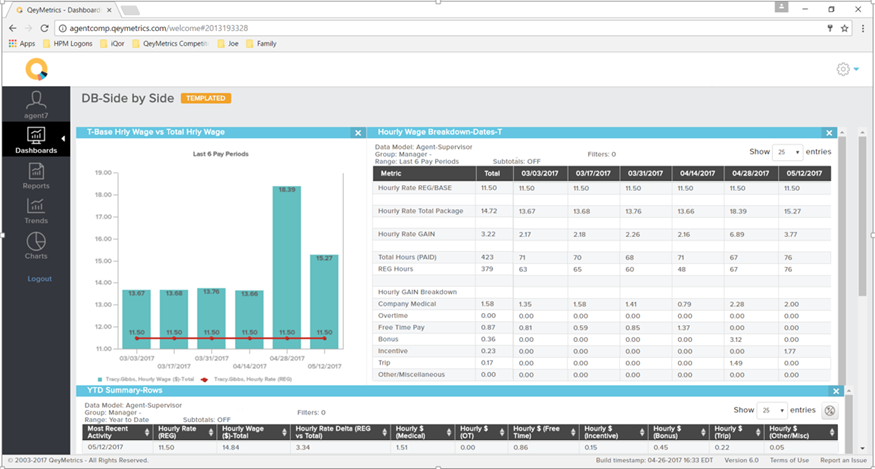
Likewise, a compensation dashboard is extremely beneficial. Bonuses, free time, overtime, and other perks are viewable so that agents understand that there’s much more to their paychecks than just base wage. The compensation dashboard leads agents to stick around longer and is also a unique benefit to showcase while recruiting.

iQor recently implemented our own agent performance and compensation dashboard through our proprietary business intelligence tool. Through our own learning experience, we’ve cracked some codes on a few key differentiators we think will spark life back into your agents – especially when dealing with stale performance, attrition, or growing apathy.

Quick Note on Metrics

When it comes to choosing dashboard metrics, the key is to provide visibility into what matters most to your agents and review them frequently. In our contact centers, we never go full year without a review. And thanks to having their own set of tools to supplement these face-to-face interactions, agents go into meetings and coaching sessions as better communicators and problem-solvers.

  1. Keep Agents Longer with a Compensation Dashboard

Through iQor’s personalized ‘Qompensation’ Dashboard, agents can view and track recent pay periods and see a full year-to-date snapshot. The compensation dashboard gives a complete picture, including associated bonuses and benefits that agents either are or could be receiving. With a clear status of their money (and its potential), your agents are more likely to stick around longer, and less likely to leave for a seemingly menial pay increase.

Here is an example breakdown of a total compensation package:

  • Company medical
  • Overtime
  • Free time pay
  • Bonus
  • Cash incentives (including non-cash incentives such as gift cards, electronics, and other tangible items), contests, or direct recognition
  • Referral bonuses
  • Company-provided compensation (may include retroactive pay, bereavement, jury duty, etc.)
qey agent dash 1-2
Compensation Dashboard

Sharing this Total Compensation Dashboard with the Agents as part of a larger Retention project helped decreased Annual Attrition rates across the company by over 12%.

  1. Drilldown to Details for More Accountability and Collaboration

Provide agents with the ability to go beyond seeing summary level key performance indicator scores (KPIs) by allowing them to drill further into the context of the interaction and feedback that a customer or quality analyst gave them.

Allow agents to see the outcome from the customer’s viewpoint (i.e., how the customer defines quality) in the context of important company metrics. This opportunity for detail fosters an environment of self-learning, accountability, and more engaging and impactful discussions with managers.

For example, your agent dashboard may provide more drill-able insights on the following:

  • First call resolution (FCR) score
  • Survey response
  • Call category/type
  • Customer inquiry history

A drilled-down report of a low FCR score may include a survey response. The customer may have simply said, “The agent didn’t know how to solve my problem.” Not very helpful on its own. But when it’s paired with the right information on the type of call and customer’s inquiry history, the agent then has all the necessary information to pinpoint the underlying issue. In this case, it could be that the script or handbook is actually missing the solution to that specific topic. The agent can then bring this to the manager’s attention to resolve and ensure that the program’s training material, scripting, and knowledge bases are updated accordingly. Future frustration averted.

  1. Integrate Interaction Analytics to Build Trust

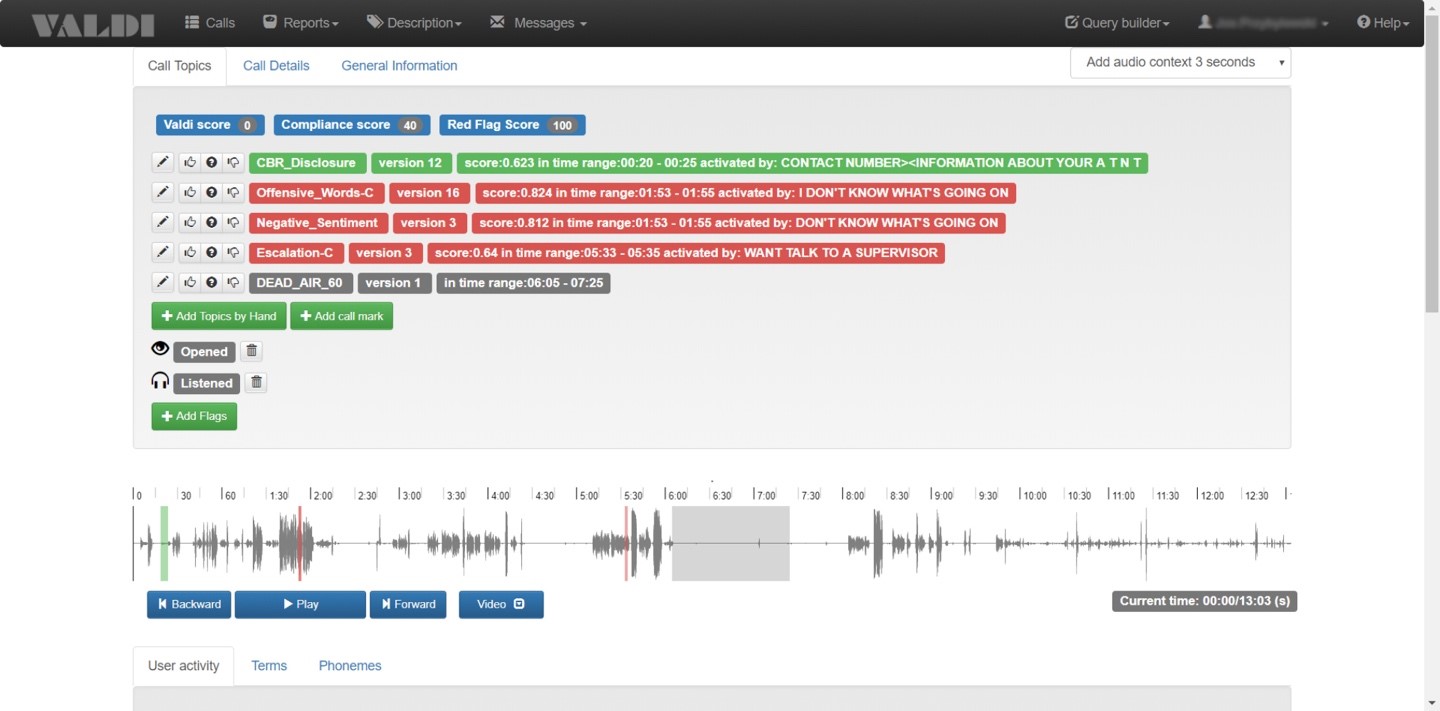
Move beyond traditional KPIs and indexes by integrating interaction (voice, email, chat, social) analytics with drill-able insights. Metrics such as dead air, customer sentiment, escalations, and compliance are extremely beneficial to front-line agents and can serve as an immediate learning experience.

qey agent dash 2
Performance Dashboard

iQor allows agents to drill down into flagged interactions using our interactions analytics. Allowing agents to listen to or read these interactions drives self-correcting behavior and builds trust between the agent, QA team, and leadership. With the full story clear to all parties, agents are less likely to question negative customer feedback presented at review sessions or quality assurance meetings. Engagement will be higher and agents will be more open to discussing improvement strategies.

qey agent dash 3
Call Analytics Dashboard
  1. Create Friendly Competition with an Agent Performance Scorecard

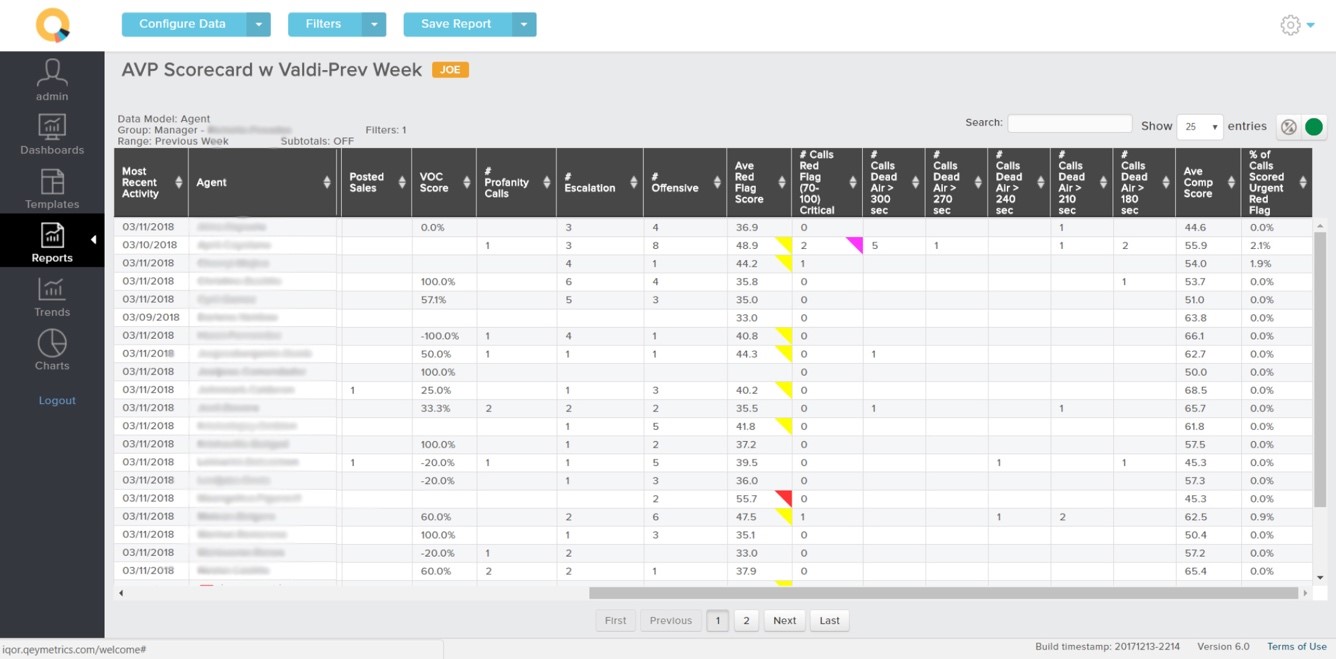
Incorporating front-line voice of customer (VOC) data and a well-rounded scorecard allows agents to see the impact they are making in real-time.

Your performance dashboard may easily provide agents with any one or all of the views below:

  • Personal performance vs. company goal
  • Personal performance vs. team averages
  • Personal performance vs. peers
qey agent dash 4
Scorecard Dashboard

This type of intel isn’t new to the agent, but seeing positive and negative feedback outside a coaching session or performance review drives employees to improve, compete with themselves and others, and gives them the chance to recognize other top performers.

Final Thoughts

Customer service agents are the face of your brand, but sometimes they need help in keeping pace and understanding how you and your customers define a quality relationship. Like a runner to their fitness watch, the right level of transparency will inspire agents to perform better. They will be more driven to break their own personal records by improving personal accountability and self-motivation – leading them to stick around longer and shift the call floor culture for the better.

Click here to learn more about iQor’s performance dashboards, business intelligence, and CX analytics can work for you.